Introduction
Earlier in the year Karatfix was flying. Then in June, a 52pt drawdown to betting bankroll shook confidence.
Some members left the service. Others asked if the edge was gone.
But when we dug into the numbers? We saw something else entirely — a pattern that fits perfectly within expected variance for a tipster betting average odds of 2.88.
That’s what this post is all about:
📉 What kind of swings are normal?
💰 How big should your betting bankroll be?
🔍 How often would you expect a major drawdown?
Welcome to the first in our new Bet Bots Betting Tipster Bankroll series — starting with one of our most popular (and most discussed) tipsters: Karatfix.
🧠 Karatfix Betting Style at a Glance
| Metric | Value |
|---|---|
| Sport | Tennis |
| Avg Odds | 2.88 |
| Avg Stake | 2pts |
| ROI | ~7% (based on Blogabet) |
| Volume | ~700 bets/year |
| Markets | Betfair Exchange & Pinnacle |
This is a mid–high volatility service with a proven long-term edge. The strike rate is lower (as expected with bigger prices), which makes variance a much bigger factor than for lower-odds services.
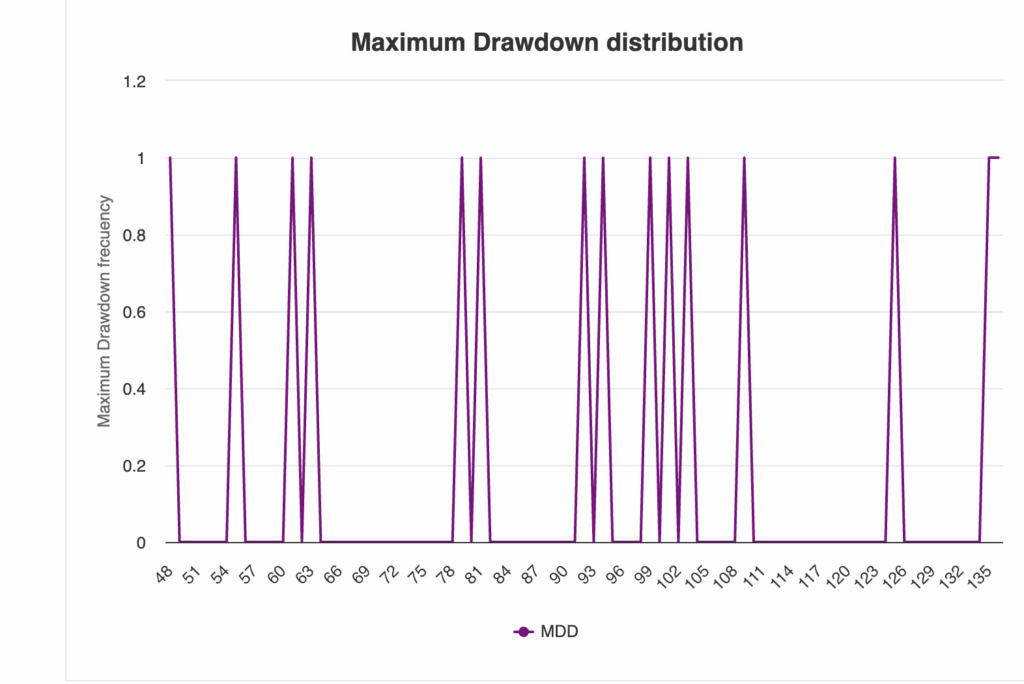
📊 Simulation Summary – Full Sample (2,300 bets)
We ran 15 simulations based on Karatfix’s Blogabet stats to model what might happen over a typical sample of 2,300 bets (roughly 3–4 years of betting at current volume).
Key Outcomes:
- Highest Drawdown (Max): 135pts
- Drawdowns >100pts: 3 out of 15 runs
- Most common range: 65–105pts
- Current Max Bet Bots drawdown: 73pts ✅ Within normal limits
This puts his real-world losing run into clear context. It’s not a collapse. It’s what happens when you’re betting with a genuine edge and higher average odds.
📉 Betting Bankroll: One-Season Model (700 Bets)
What about a more realistic sample — say, one full year of tipping?
We modelled this too, and the numbers look like this:
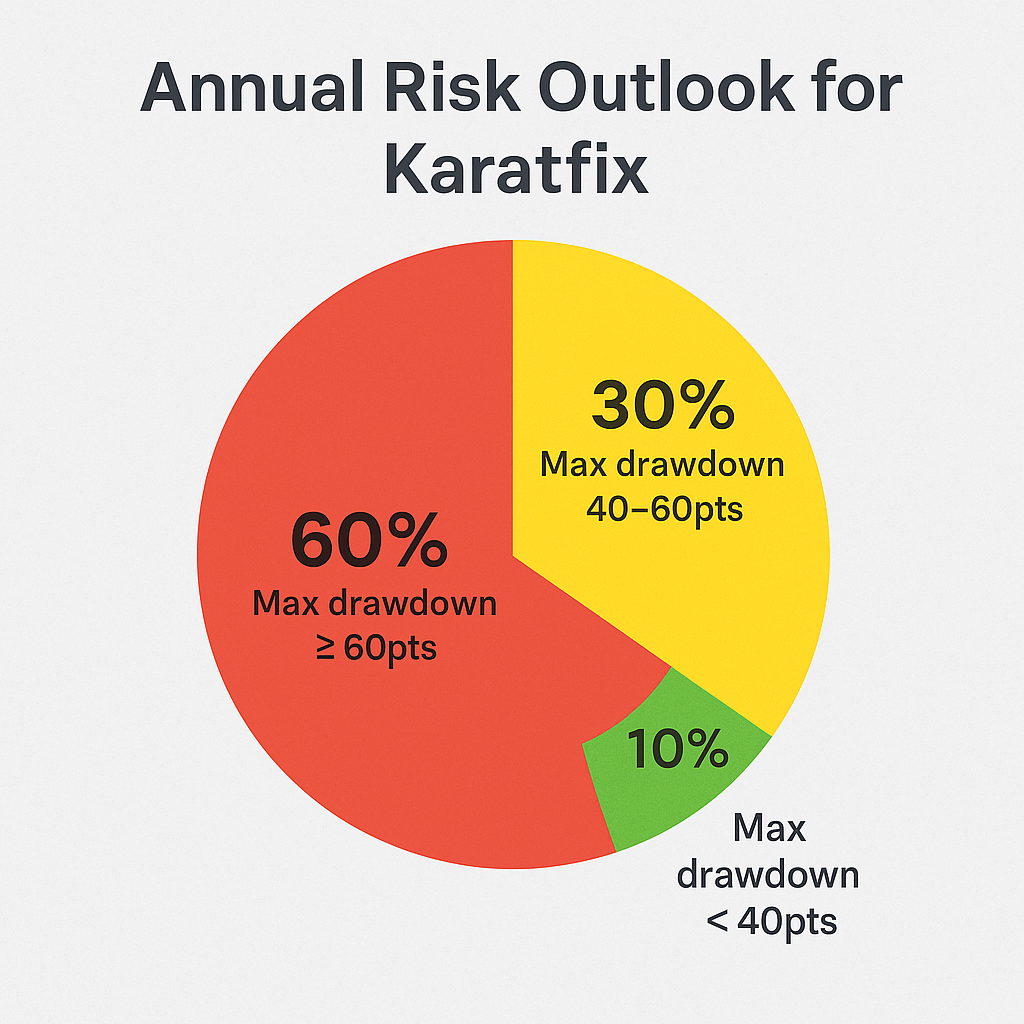
- Expected Drawdown (EMDD): 62pts
- Average Max Drawdown (XMDD): 58pts
- Median Max Drawdown: 55.5pts
- Probability of 60pt+ Drawdown in a Year: 60%
- Probability of Profit (ROI ≥ 0): 90%
📌 Practical Implications:
Karatfix averages around 700 bets per year, so:
- 🧭 You’re likely to encounter one significant drawdown per year
- 🎢 That yearly dip might range from 40–90pts, depending on variance
- 🧮 Median max drawdown: ~55pts – a realistic benchmark for the most common “bad run” you’ll face
It reinforces that these drawdowns aren’t outliers — they’re part of the long-term rhythm of high-odds value betting.
✅ Implication for Betting Bankroll
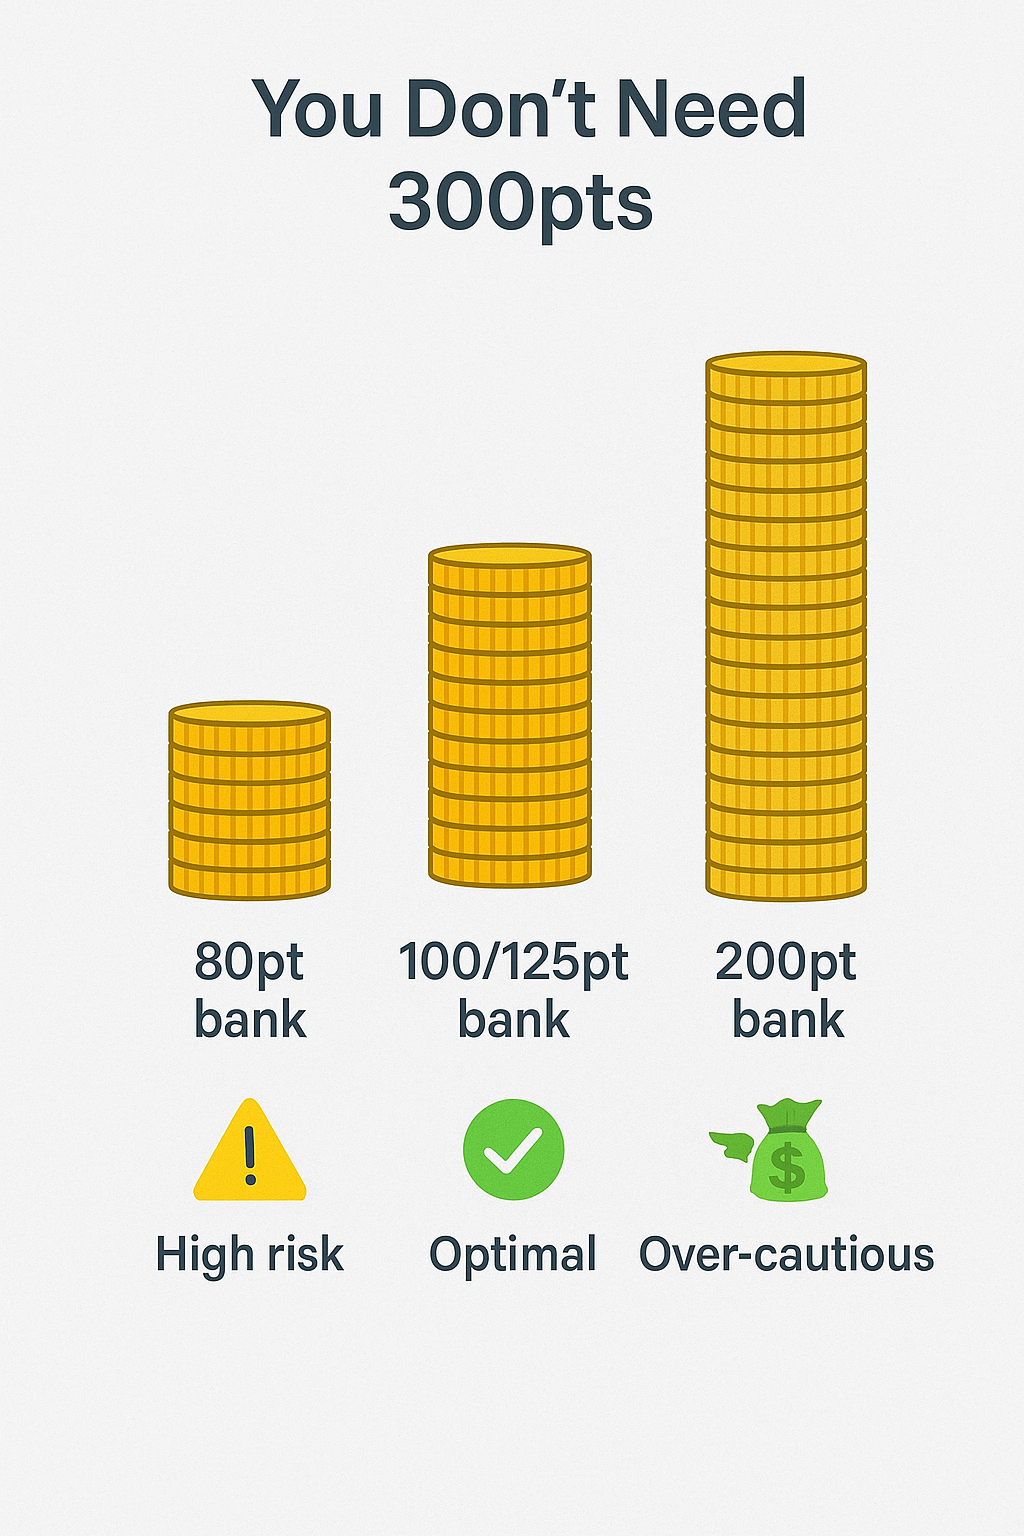
Even within a single season, having 100pts as a bankroll gives you a wide enough margin to withstand temporary losses.
You could potentially lower to 80pts if you’re comfortable with a bit more risk — but 100pts remains the most efficient balance between robustness and sustainability.
Let’s put that in perspective:
- 💥 A 60pt drawdown is likely in most years
- 🧱 A 100pt bankroll can handle this without stress
- ❌ A 200pt+ bankroll is unnecessary based on the data
- 🟨 If you find yourself questioning the service during a 70pt swing — remember, that’s the middle of the expected range
🔄 Summary
We’ve now modelled Karatfix’s historical edge through two sample sizes — and both confirm the same thing:
📌 Drawdowns are expected.
📌 Your bankroll should be built around them.
📌 The edge is real — if you’re patient enough to ride it.
Next Up in the Series: Bonz
We’ll be taking a look at how Bonz’s short-odds, high-frequency in-play style results in a much smoother betting curve — and a different bankroll recommendation entirely.
Bookmark this page or follow along via Telegram or X as the series rolls out.